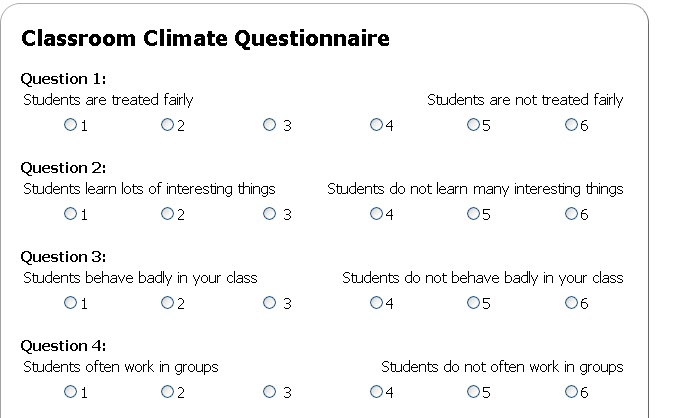
Recently, as part of our Professional Enquiry Groups, I have been working on 'the classroom climate' tool. This allows you, as the teacher to answer a number of questions on a scale of 1-6 on that particular classroom's climate. You can then ask a certain set of students (I focussed on one class and one student from each table who I felt would be 'representative' of that table) to answer the same questions.
This then returns a set of results in graph form where you can compare how accurate your predictions about that class were compared to the students' view of that class.

With the graph or the ability to see the difference between the students' average score and my score, I was able to see the differences in perceptions of the classroom. This could have been positive differences, for instance I found out that this class had found what we learnt interesting despite my reserves about the content taught and tasks completed! Similarly, I could see the negative differences, for example I found out that the class felt that they did not get the chance to present to the rest of the class enough.
Additionally, with the help of the web designers, I was then able to go more in-depth and see each student's individual answers.
For example, I was able to see all the students' answers to the question 'are students encouraged to help each other?'. On one end of the scale was 'students are not encouraged to help each other' which students would have to rate as 6, and at the other end was 'students are always encouraged to help each other' which students would have to rate as 1. As I felt that the classroom was a fairly co-operative place I rated it as '2' and the students' responses were four 1s, three 2s and one 4. This tells me that I was fairly accurate (1.9 mean score). However, it also tells me that the one student who rated it as '4' obviously doesn't feel that there isn't a chance for students to encourage each other. This then allows me to either to speak to that student to find out what he/she feels about the co-operation in the classroom and what I can do to help them.
I can then create a classroom profile of each students' difficulties in the classroom e.g. Joe Bloggs feels that 'the air is stuffy in the classroom' and that 'the work set in class is too difficult' whereas Jane Doe feels that 'some students get all the praise' and 'students behave badly in the class'. This gives me a real insight to how to manage each student and what will help each and every student in the classroom.
It takes a good deal of trust between you and your responses to answer honestly and responsibly. It also means that the questions have to be worded very carefully for the students to understand and be able to respond appropriately. These questions were based on Professor Daniel Muijs and David Reynolds' research on classroom climate and effective teacher behaviours which I can supply if anyone requires them.
I followed up these initial responses with an informal discussion with the students (providing food and drink of course!) who had responded to the questionnaire to talk through their responses as a group. I was able to have an open discussion with them about how it was eye-opening for me to find out that they found the content interesting and they explained why in a very mature manner. They were also able to discuss what they felt I could do to improve in terms of allowing them to present to the class and why this would be beneficial to their learning. I felt that the students felt quite empowered by being able to discuss openly with me about what were positives about the classroom but also how I could improve which is why I felt they responded in such a mature manner. I have since implemented a few changes to my teaching to try and reflect their views and perceptions of the classroom.
Even if you don't have the classroom climate software available at your school, it would be easy enough to set up with a questionnaire on Google docs (or even old school paper questionnaire if you're not up to it!) and a few formulae on Google sheets (or you working out the averages/differences yourself).
In the next few weeks, I plan to get the same students to answer the same questions to see if their answers any differently as well as redoing the questionnaire myself. Finally, I hope to have another discussion with the same students to analyse my teaching further as no teacher is ever perfect! I would massively advise anyone interested in finding out what their class really thinks of them to try out this method as it certainly has helped me to differentiate in the class to a new degree as well as help certain aspects of my teaching just with that class. Any questions that people have or any attempts at the classroom climate please do email/tweet me. Many thanks to Ken Brechin for his help on the PEG.
No comments:
Post a Comment